
Anomaly detection algorithm implemented in Python
This post is an overview of a simple anomaly detection algorithm implemented in Python. While there are different types of anomaly detection algorithms, we will focus on the univariate Gaussian and the multivariate Gaussian normal distribution algorithms in this post.
Anomaly detection problem is the identification of outliers in data points relative to some standard or expected outcome. It has significant wide range of applications in several industries due to the critical and actionable information it provides. Some of the examples of anomaly detection are fraud detection in an online transaction, an unexpected growth of users on a website in a short period of time that looks like a spike, another is a production plant where the sensors may indicate faulty components and monitoring of computer servers in a data centre.
The basic approach of anomaly detection is defining a boundry around the normal data points that separates them from the outliers. However, several factors make this approach very challenging and it’s not very straightforward in itself.
In this post, we will implement anomaly detection algorithm to detect outliers in computer servers in a data centre for monitoring purpose. The Gaussian distribution model is used for this example. First, we will describe the univariate gaussian distribution model, after that we will detailed the multivariate gaussian distribution and lastly, carry out the implementation in Python.
Univariate Gaussian normal distribution model
Here we present some basic facts regarding the Gaussian normal distribution model. It is commonly expressed in terms of the parameters , and , where is the feature matrix, is the mean and is the covariance matrix.
- Choose features that might be indicative of anomalous examples
-
Fit parameters
-
Given new example , compute
- Anomaly if
For our case study, monitoring computer servers in a data centre let us go through the process of choosing our feature . Normally we may want to choose features that might on unsually large oe small values in the event of an anomaly. For example, some of the features we may want to choose would be;
= memory use of computer
= number of disk accesses/sec
= CPU load
= network traffic
Let us assume we suspect that one of our computers gets stuck in some infinite loop so that the CPU loads grows but the network traffic does not. In this case, to detect such kind of anomaly, we may have to create a new feature such that;
This approach of manually creating our features really helps in detecting anomaly or unusaul combinations of values that would not have possibly been flagged by our algorithm. However, where our algorithm fails to detect an anomaly and we don’t have the luxury of creating new features, how do we go about fixing this?
One possible way of fixing this sort of strange behaviour is to develop a modified version of the Gaussian normal distribution known as the multivariate Gaussian distribution.
Multivariate Gaussian distribution model
The multivariate Gaussian distribution is expressed in terms of parameters and , where is an vector and is an , covariance matrix. The multivariate Gaussian model automatically captures the correlations between features so that we don’t have to manually create them.
Instead of modelling our separately like we did in Gaussian normal distribution, we are going to model our all in one goal.
Given parameters: and (covariance matrix)
To detect anomaly with the multivariate Gaussian distribution, we go through the following;
- Given training set
- Fit model by setting
- Given a new example , compute
- Flag an anomaly if
It is possible to show mathematically that the original Gaussian distribution is thesame as the multivariate Gaussian but with a constrain. The constrain is that the covariance matrix must have all zeros on the off diagonal elements of the matrix.
While this approach automatically captures correlations between features, it is computationally more expensive to implement. The Gaussian normal distribution is cheaper and scale better.
Python implementation of anomaly detection algorithm
The task here is to use the multivariate Gaussian model to detect an if an unlabelled example from our dataset should be flagged an anomaly. To keep things simple, we will only deal with a simple 2-dimensional dataset. The dataset only contains two features; the throughput and latency response of each server. First let us visualise our dataset and explore what exactly is going on.
Data exploration
Before we start, we need to explore our dataset, plotting our features will help us have good visual representation and give us better insight of what is going on. To accomplish this, we must first import all the important libraries using Python.
import matplotlib.pyplot as plt
import numpy as np
%matplotlib inline

from numpy import genfromtxt
from scipy-stats import multivariate_normal
from sklearn.metrics import f1_score
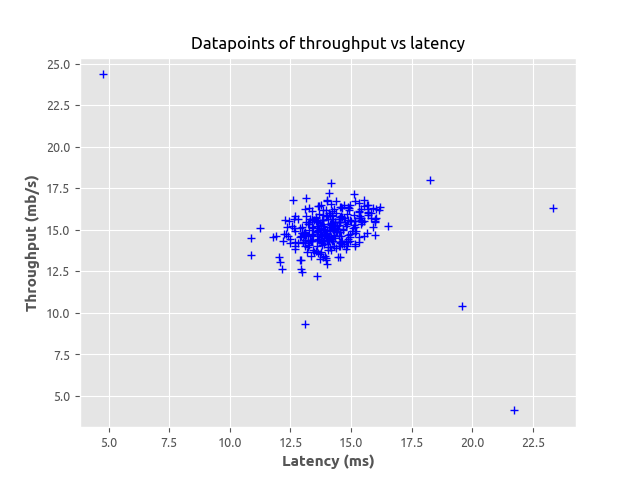
As shown in the figure, we can see the datapoints tightly clustered at the centre with some few points further away from the cluster. Merely looking at the graph, we can easily tell from this simple example those points futher away from the cluster could be considered anomalies. But our goal here is to use the multivariate Gaussian model algorithm to estimate the each feature in the datapoints. For us to achieve this, we may want to define some certain functions that made up our Gaussian distribution, compute the mean and variance for each feature in our dataset.
#define the function for reading our data
def read_dataset(filePath, delimiter=','):
    return genfromtxt(filePath, delimiter=delimiter)

#define paramter for feature normalization
def feature_normalize(dataset):
    mu = np.mean(dataset, axis=0)
    sigma = np.std(dataset, axis=0)
    return (dataset - mu) / sigma

#define the parameter and estimate the Gaussian distribution
def estimate_gaussian(dataset):
    mu = np.mean(dataset, axis=0)
    sigma = np.cov(dataset.T)
    return mu, sigma

#define the multivariate Gaussian distribution
def multivariate_gaussian(dataset, mu, sigma):
    p = multivariate_normal(mean=mu, cov=sigma)
    return p.pdf(dataset)
Implementing the anomaly detection algorithm using the Gaussian model
Next is for us to define a function that will help us get the optimal value for the threshold which will be use to separate the normal and the anomalous datapoints. We are going to make use of the cross validation dataset to learn the optimal values of . To achieve this, we are going to try different values in a range of learned probabilities. We will then calculate the f1-score for the predicted anomalies based on the ground truth available data. The with the highest value of f1-score will be our threshold. This means that the probability that lie below the selected threshold will be considered anomalous.
def select_threshold(probs, test_data):
    best_epsilon = 0
    best_f1 = 0
    f = 0
    stepsize = (max(probs) - min(probs)) / 1000;
    epsilons = np.arange(min(probs), max(probs), stepsize)
    for epsilon in np.nditer(epsilons):
        predictions = (probs < epsilon)
        f = f1_score(test_data, predictions, average='binary')
        if f > best_f1:
            best_f1 = f
            best_epsilon = epsilon

    return best_f1, best_epsilon

mu, sigma = estimate_gaussian(train_data)
p = multivariate_gaussian(train_data,mu,sigma)

#selecting optimal value of epsilon using cross validation
p_cv = multivariate_gaussian(crossval_data,mu,sigma)
fscore, ep = select_threshold(p_cv,test_data)
print(fscore, ep)

#selecting outlier datapoints
outliers = np.asarray(np.where(p < ep))
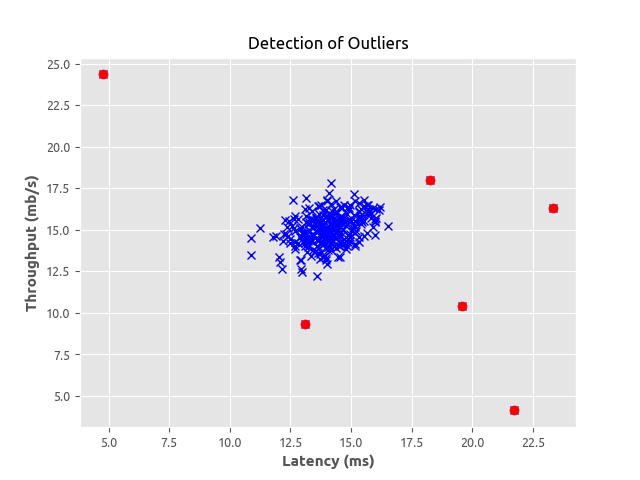
Looks pretty cool right? The points in red are the ones that were flagged as the outliers which were not far from what we observed in the first graph when exploring the datapoints. This really makes sense. We have been able to implement a simple anomaly detection algorithm using the Gaussian distribution model. This post was inspired from Andrew Ng Coursera machine learning course.
You can get the complete source code I used in implementing this algorithm from my repository here.
Leave a Comment